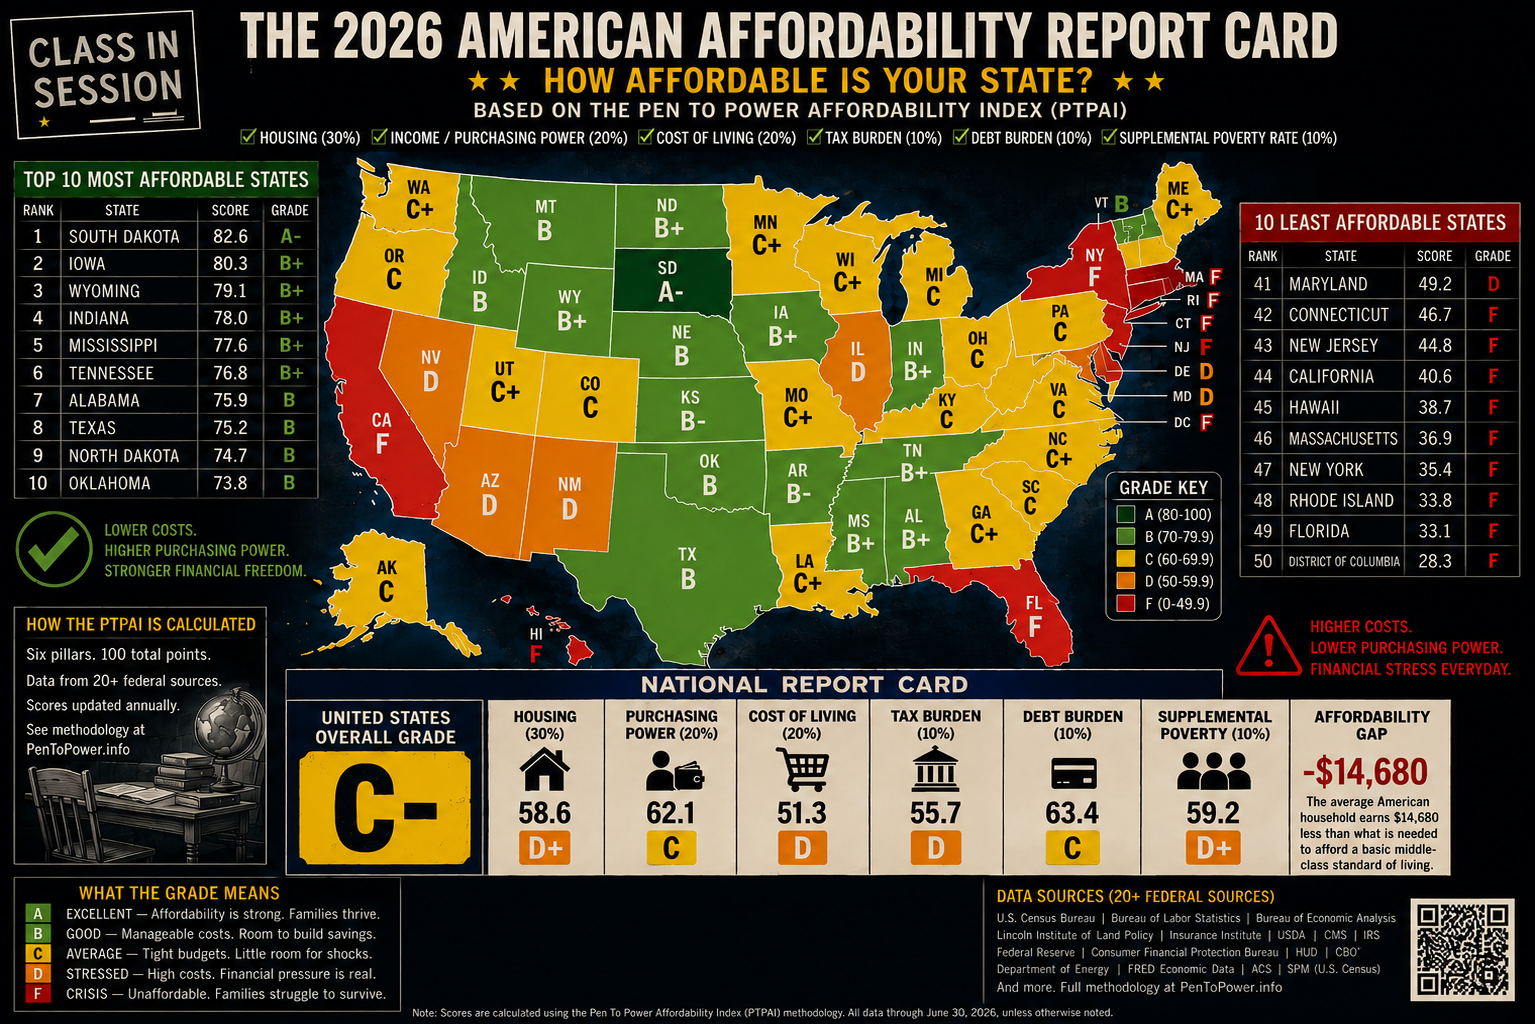
2026 American Affordability Report Card with state letter grades, national summary, rankings and methodology notes
Open full-size report card
20Verifiable measures
6Connected pillars
51Jurisdictions
357Historical records
±3.8Composite MoE

TRANSPARENT BY DESIGN

Twenty measures. Six pillars. Published calculations.

The Index combines Housing (30%), Income/Purchasing Power (20%), Cost of Living (20%), Tax Burden (10%), Debt Service (10%) and Supplemental Poverty (10%). Every historical row includes a data status and documented margin of error.

Every number comes from a named source. Every measure has a retrieval schedule. Any state may challenge its calculation with evidence.
Open full technical methodology

Data status standard

Final
Official annual data incorporated and reconciled.
Experimental
2020 data affected by pandemic collection limitations.
Preliminary
Current-year estimates awaiting final annual releases.
Live 2026
Report-card summary published while jurisdiction rows are verified.

AFFORDABILITY GAP

What is GAP?

The GAP is the dollar shortfall or surplus attached to the published Affordability Index record for a state and year. A negative number means the measured household benchmark is short; a positive number means it is above the benchmark.

Important: Pen to Power is currently formalizing the ZERO benchmark from the 20 Index measures. When that benchmark is complete, this explanation will be updated so the GAP is explicitly tied to the gross income required to reach $0 remaining after taxes and measured costs.

VERIFY THE INDEX

Should you trust this Index?

You shouldn't. Not automatically.

Affordability is often reduced to a CPI release, a jobs report, or a political talking point. Pen to Power instead organizes 20 independently verifiable measures into six connected pillars and publishes the evidence chain behind the result.

You lived the changes being measured. Use that experience as a reason to inspect the work, not as a reason to accept it blindly.

Every calculation, formula, weight, data source, margin of error, revision, and assumption is intended to be open for review. If you believe a score is wrong, inspect the methodology, review the source data, reproduce the calculation, and challenge it with evidence.

Pen to Power Publishing
pentopowermoon@gmail.com

METHODOLOGY OVERVIEW

How the grade is built

PTPAI = (Housing × .30) + (Income × .20) + (Costs × .20) + (Taxes × .10) + (Debt × .10) + (SPM × .10)

Historical dataset

The interactive matrix contains 51 jurisdictions for each year from 2019 through 2025. Each row carries all six pillar scores, the composite, grade, affordability gap, data status and margin of error.

2026 live view

The 2026 report card is displayed as the current public summary. Detailed 2026 jurisdiction rows will join the matrix after verification rather than being silently estimated.

Margin of error

The documented composite margin of error is ±3.8 points. States separated by fewer than four points should not be treated as meaningfully different without examining the underlying measures.