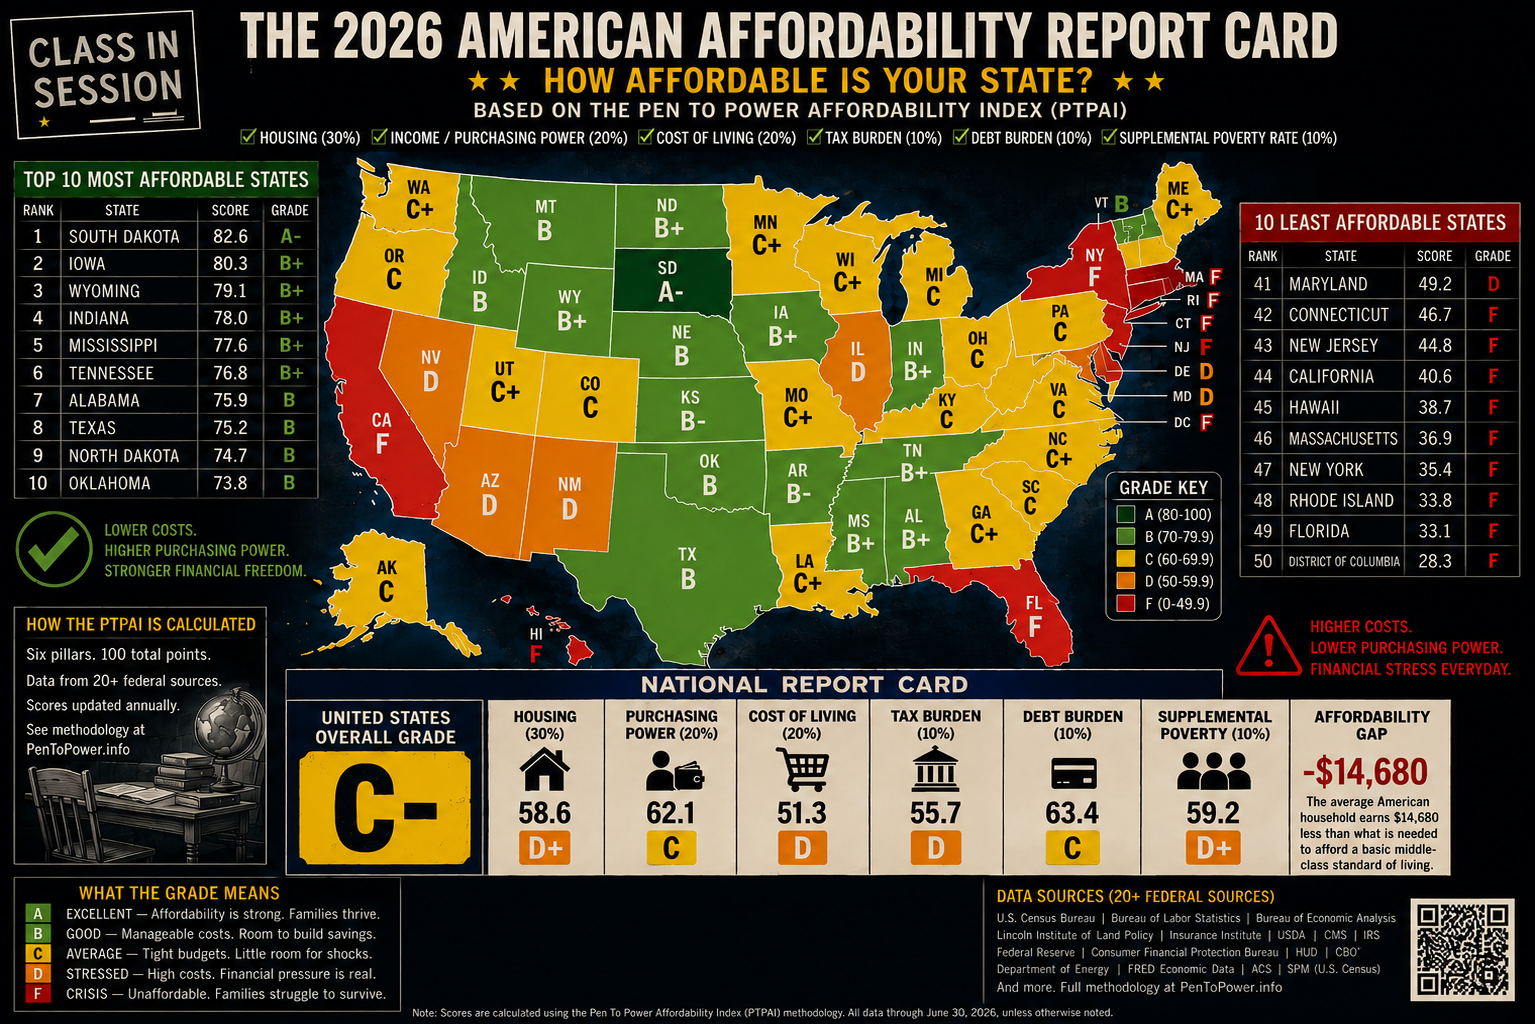
The grade is the headline. The evidence chain is the product.
Inspect the methodologyLoading state boundaries and index data…
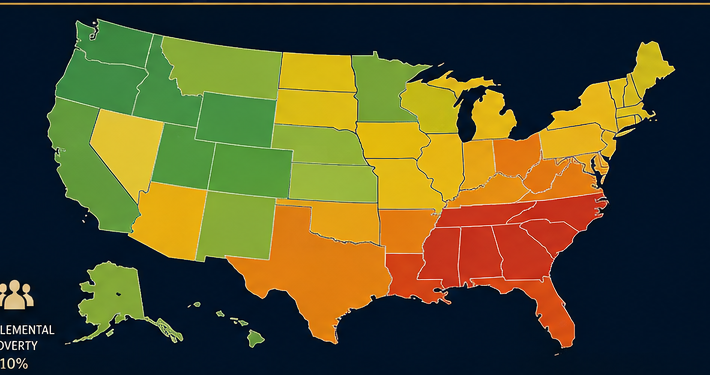
2026 LIVE REPORT CARD
2026 map published. Detailed state rows are still being verified.
The map above reflects the current 2026 report card. Historical state rows remain fully interactive for 2019–2025.
Open 2026 report cardSTATE MATRIX
2025 Overall Rankings
Sort, search and select any jurisdiction. Every row comes from the published historical dataset.
| Rank | State | Housing | Income | Costs | Taxes | Debt | SPM | Composite | Grade | Gap | Status |
|---|
TRANSPARENT BY DESIGN
Twenty measures. Six pillars. Published calculations.
The Index combines Housing (30%), Income/Purchasing Power (20%), Cost of Living (20%), Tax Burden (10%), Debt Service (10%) and Supplemental Poverty (10%). Every historical row includes a data status and documented margin of error.
Every number comes from a named source. Every measure has a retrieval schedule. Any state may challenge its calculation with evidence.
Data status standard
- Final
- Official annual data incorporated and reconciled.
- Experimental
- 2020 data affected by pandemic collection limitations.
- Preliminary
- Current-year estimates awaiting final annual releases.
- Live 2026
- Report-card summary published while jurisdiction rows are verified.